Image Details
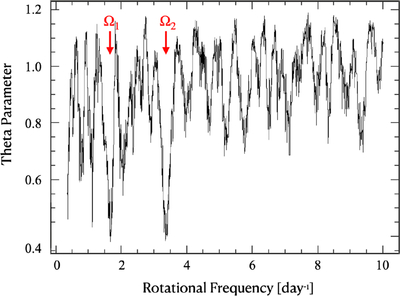
Caption: Figure 2.
Phase dispersion minimization plot showing the minimization parameter as a function of the assumed rotational frequency. Minima at Ω1 = 1.669 day−1 and Ω2 = 3.339 day−1 correspond to rotational periods at 0.599 day and 0.299 day, respectively. Ω1 and Ω2 denote the two-peaked and single-peaked lightcurves, respectively.
Other Images in This Article
Copyright and Terms & Conditions
© 2026. The Author(s). Published by the American Astronomical Society.
Copyright ©
2026 Astronomy Image Explorer. All Rights Reserved.