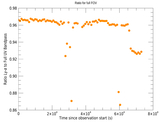
Image Details
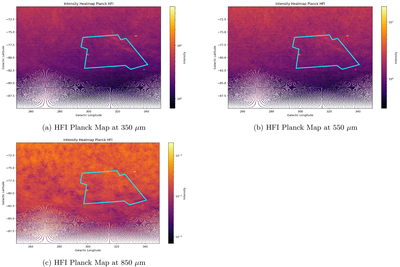
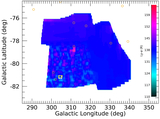
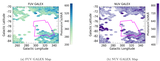
Caption: Figure 9.
Subset of maps showing variability in observed signal at 350 μm, 550 μm, and 849 μm as observed by HFI on the Planck space observatory in the region of sky where the Lyα scans were made. The units for the Planck observations are Kcmb at 550 μm and MJy sr−1 at 849 μm. The cyan region outlines the region of space observed during the Alice scans. Some variation in the Planck data is noted in each, particularly at 849 μm. There is also a cloud-like structure most easily seen in the 350 and 550 μm data panels stretching from 315° to 330° in Galactic longitude and −75° to −79° in Galactic latitude.
Other Images in This Article
Copyright and Terms & Conditions
© 2026. The Author(s). Published by the American Astronomical Society.
Copyright ©
2026 Astronomy Image Explorer. All Rights Reserved.