Image Details
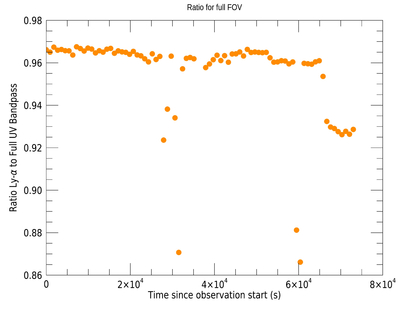
Caption: Figure 8.
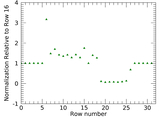
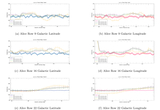
Ratio of the Lyα signal to the full UV bandwidth after summing the signals across the entire Alice FOV. The small gap in data is during the time between the first and second scan. The drops below 95% all occur when stars are present in the FOV. The drop is less pronounced than seen in Figure 7 because an individual star in a single row contributes significantly less when measuring the Lyα signal across the entire detector. The average ratio is between 96% and 97%, supporting the use of the instrument in photometer mode to accurately report on Lyα within 4% without needing to collect the full UV spectrum and isolating the emission line for large-scale maps such as those produced by G. R. Gladstone et al. (2025).
Other Images in This Article
Copyright and Terms & Conditions
© 2026. The Author(s). Published by the American Astronomical Society.