Image Details
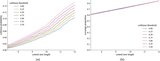
Caption: Figure 10.
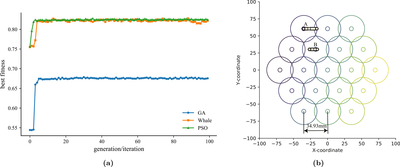
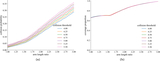
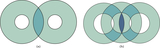
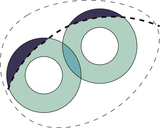
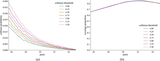
(a) Schematic representation of the fitness evolution during optimization for determining the optimal R and pitch. The horizontal axis represents the number of iterations or generations, while the vertical axis indicates the fitness value. (b) This distribution map shows the best results when changing R and pitch. RFP at A in unfolded state, B in collapsed state.
Other Images in This Article
Show More
Copyright and Terms & Conditions
© 2026. The Author(s). Published by the American Astronomical Society.
Copyright ©
2026 Astronomy Image Explorer. All Rights Reserved.