Image Details
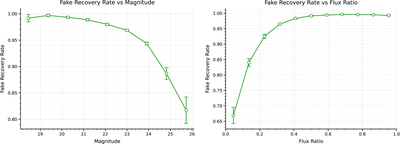
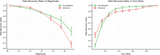
Caption: Figure 4.
Fake recovery rate (true-positive rate) analysis on the autoScan test data. (Left) Fake recovery rate as a function of magnitude. (Right) Fake recovery rate as a function of flux ratio. The flux ratio is defined as ﹩\,\rm{clip}\,\left(0,1,\frac{{f}_{d}}{{f}_{t}+{f}_{d}}\right)﹩, where fd and ft are fluxes of 5 by 5 central grids in difference and template images, respectively. Since both difference and template images are sky-subtracted, this ratio could fall outside the [0, 1] range. Bins with at least 25 test samples are shown in both panels.
Other Images in This Article
Copyright and Terms & Conditions
© 2026. The Author(s). Published by the American Astronomical Society.
Copyright ©
2026 Astronomy Image Explorer. All Rights Reserved.