Image Details
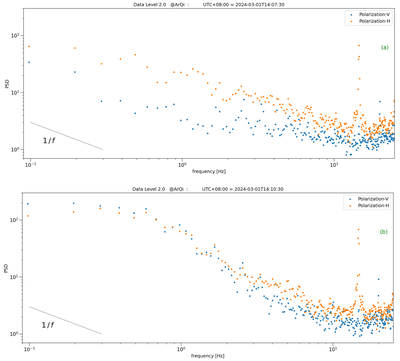
Caption: Figure 3.
(a) off-source and (b) on-source profiles of power spectrum density for the vertically and horizontally polarized emissions from 3C446. One dashed black line with an inverse power denotes the 1/f noise associated with the off-source measurement. An animation of spectral profiles during the whole 5 minute transit of 3C446 is provided in the online Journal.
(An animation of this figure is available in the online article.)
(An animation of this figure is available.)
The video/animation of this figure is available in the online journal.
Other Images in This Article
Copyright and Terms & Conditions
© 2026. The Author(s). Published by the American Astronomical Society.
Copyright ©
2026 Astronomy Image Explorer. All Rights Reserved.