Image Details
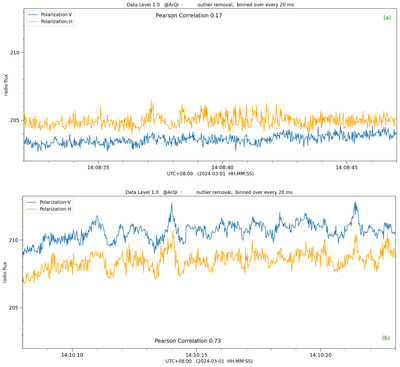
Caption: Figure 2.
(a) Off-source and (b) on-source segments of 15 s time-series data at level L1.0 for the vertically and horizontally polarized emissions from 3C446. An animation of polarized radio fluxes during the whole 5 minute transit of 3C446 is provided in the online Journal. The animation, which runs for 17 s, covers from approximately 14:08:29 to 14:12:11 (UTC+08:00). The Level L1.0 data processed by our pipeline and used in this paper is available, as a FITS file, in the data behind the figure in the online Journal.
(An animation of this figure is available in the online article.)
(An animation of this figure is available.)
(The data used to create this figure are available in the online article.)
(The data used to create this figure are available.)
The video/animation of this figure is available in the online journal.
Other Images in This Article
Copyright and Terms & Conditions
© 2026. The Author(s). Published by the American Astronomical Society.