Image Details
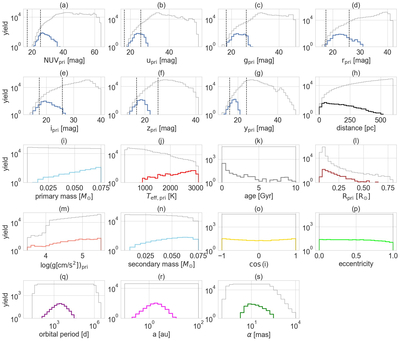
Caption: Figure 8.
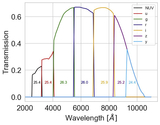
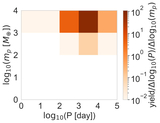
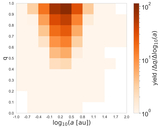
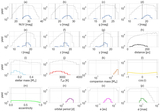
Distributions of the BD yield over parameters. The panels represent parameters as follows: primary magnitude in NUV, u, g, r, i, z, and y bands, distance, primary mass, effective temperature of primaries, system age, primary radius, log10 of the surface gravity for primaries, secondary mass, cosine of inclination, eccentricity, orbital period, semimajor axis, and angular semimajor axis. To compare with the companion yield, the gray lines in panels are plotted to show the property distributions of the brown dwarf sample or injected companions. The range between two dashed vertical lines is the magnitude range that the CSST-SC could observe.
Other Images in This Article
Copyright and Terms & Conditions
© 2026. The Author(s). Published by the American Astronomical Society.