Image Details
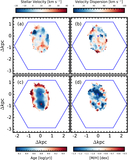
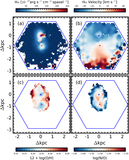
Caption: Figure 2.
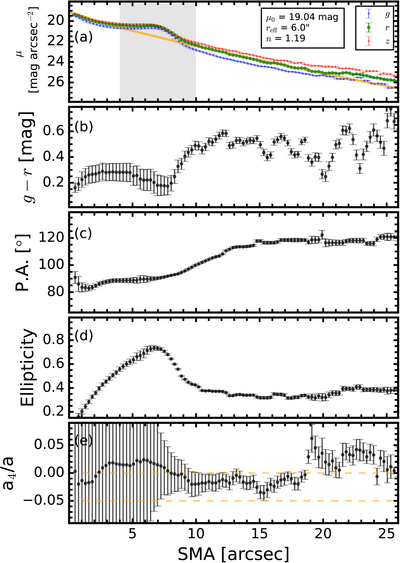
(a) Surface brightness profiles in the g, r, and z bands (blue, green, and red dots, respectively), (b) g − r color, (c) ellipticity, (d) position angle, and (e) a4/a parameter as a function of semimajor axis. In panel (a), Sérsic parameters are shown, and the gray shaded areas are excluded from the fitting process. The orange solid line represents the best-fit Sérsic function to the r-band profile. In panel (e), the horizontal orange dashed lines indicate a4/a values of 0.0 and −0.05.
Other Images in This Article
Copyright and Terms & Conditions
© 2026. The Author(s). Published by the American Astronomical Society.
Copyright ©
2026 Astronomy Image Explorer. All Rights Reserved.