Image Details
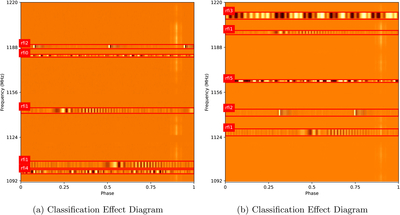
Caption: Figure 14.
Classification effect diagram. This shows the validation effect of the model on the validation dataset. The horizontal coordinate is the phase, and the vertical coordinate is the frequency. A variety of RFI data in different frequency ranges are trained by the RFI-MN classification model. In order to fully verify the robustness of RFI-MN, the validation set is used to verify the model. The RFI is detected, classified, and extracted by the model, and the prediction frame can be generated and output in the corresponding frequency range, showing high accuracy for subsequent scientific research.
Other Images in This Article
Show More
Copyright and Terms & Conditions
© 2026. The Author(s). Published by the American Astronomical Society.