Image Details
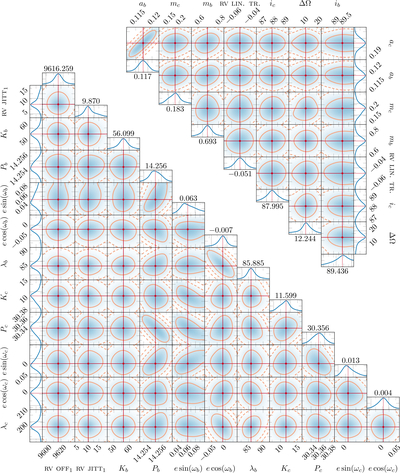
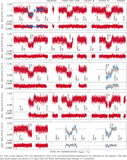
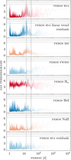
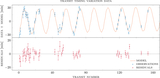
Caption: Figure A5.
MCMC posterior distribution from a TTV + RV fit. The median values of the fitted parameters and those derived are marked in red. The contours in each panel denote the 1σ, 2σ, and 3σ regions of the distribution.
Other Images in This Article
Show More
Copyright and Terms & Conditions
© 2026. The Author(s). Published by the American Astronomical Society.
Copyright ©
2026 Astronomy Image Explorer. All Rights Reserved.