Image Details
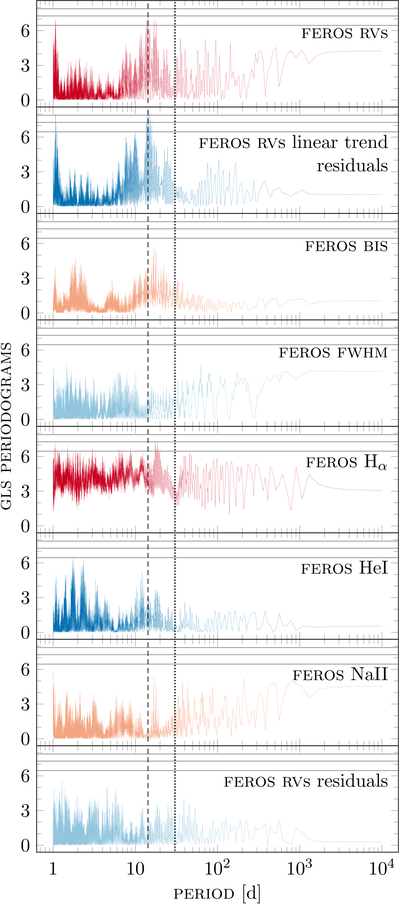
Caption: Figure 6.
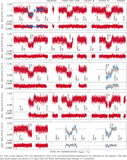
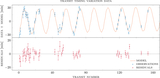
GLS power spectrum for the TOI-1232 data, based on FEROS RV spectra. From top to bottom panels, as labeled, RVs used in this work, RV residuals of the linear trend model being applied to the RV, BIS, FWHM, Hα, He I, Na II, and the residuals of our final best-fit TTV + RV self-consistent dynamical model, respectively. The dashed and dotted vertical lines indicate the orbital period of TOI-1232 b and TOI-1232 c, respectively. The horizontal lines in the GLS periodograms show the FAP levels of 10%, 1%, and 0.1%.
Other Images in This Article
Show More
Copyright and Terms & Conditions
© 2026. The Author(s). Published by the American Astronomical Society.
Copyright ©
2026 Astronomy Image Explorer. All Rights Reserved.