Image Details
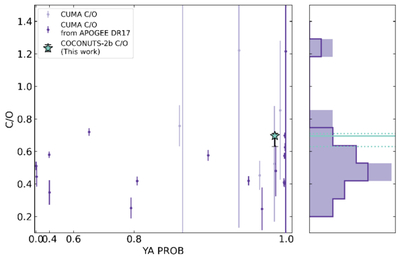
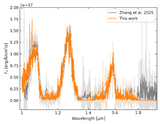
Caption: Figure 7.
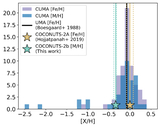
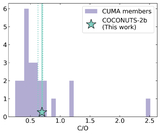
We show in the left panel C/O ratio measurements for the members of CUMA as a function of the probability of each candidate to belong to the CUMA group, and in the right panel a histogram of the values. We also show as a five-point star in the left panel, and as a horizontal line in the right panel, our result for the C/O ratio for COCONUTS-2 b from the forward-modeling analysis.
Other Images in This Article
Copyright and Terms & Conditions
© 2026. The Author(s). Published by the American Astronomical Society.
Copyright ©
2026 Astronomy Image Explorer. All Rights Reserved.