Image Details
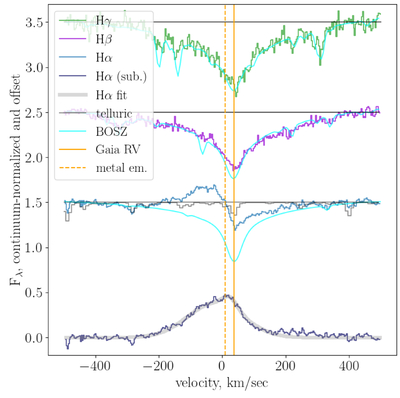
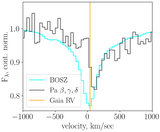
Caption: Figure 9.
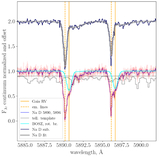
Balmer series lines Hα, Hβ, and Hγ as seen by GHOST compared with the low-metallicity BOSZ templates. The bottom curve shows Hα after subtraction of the BOSZ template and a two-Gaussian fit to the emission profile. No rotational broadening was applied to the template as these lines are intrinsically broad.
Other Images in This Article

Show More
Copyright and Terms & Conditions
© 2026. The Author(s). Published by the American Astronomical Society.
Copyright ©
2026 Astronomy Image Explorer. All Rights Reserved.