Image Details
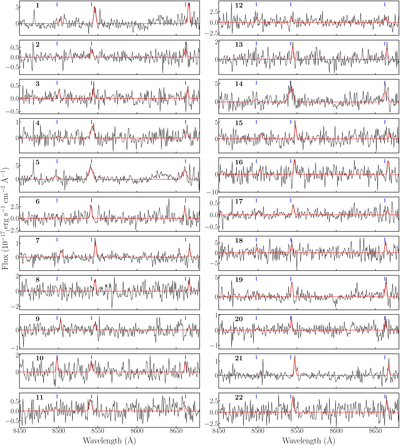
Caption: Figure 1.
Normalized spectra of the 22 white dwarfs with candidate gaseous debris disks in the vicinity of the Ca II infrared triplet, displayed in order of their IDs (labeled at top left). For each source, the black curve shows the continuum-subtracted spectrum, the red curve shows the best-fit model comprising three Gaussians, and the vertical ticks mark the rest-frame wavelengths of the triplet.
Other Images in This Article
Copyright and Terms & Conditions
© 2025. The Author(s). Published by the American Astronomical Society.
Copyright ©
2025 Astronomy Image Explorer. All Rights Reserved.