Image Details
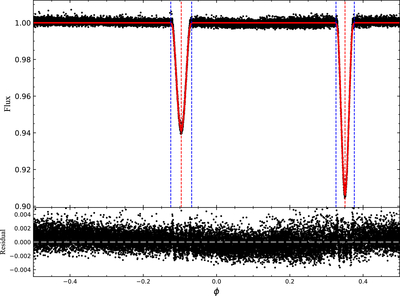
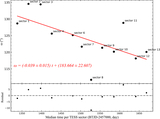
Caption: Figure A1.
LC of TIC 425549135. Black dots denote the TESS observations, while the red solid line corresponds to the best fitting based on the method of Z. Mikulášek (2015). Red dashed lines represent the mideclipse phase, while blue dashed lines represent the start or the end of the eclipse.
Other Images in This Article
Copyright and Terms & Conditions
© 2025. The Author(s). Published by the American Astronomical Society.
Copyright ©
2025 Astronomy Image Explorer. All Rights Reserved.