Image Details
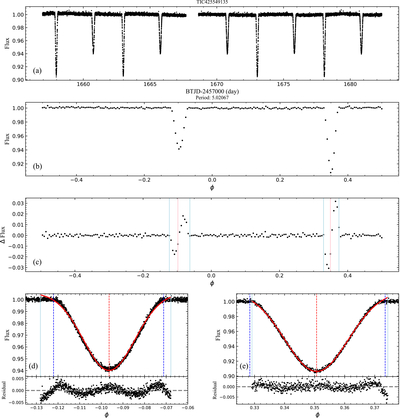
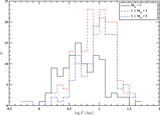
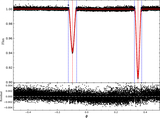
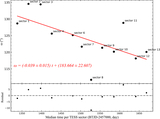
Caption: Figure 1.
LC analysis and eclipses determination for EEB TIC 425549135 as an example.(a) LC. (b), (c) The original LC is folded and smoothed to obtain the folded LC and the differential folded LC, which are used to determine the eclipses. Pink solid lines represent the rough minimum moments, and light-blue solid lines represent the rough starts and ends. (d), (e) Two eclipses (black dots) are fitted by the Gaussian function (red solid curve) to determine mideclipse phases (red dashed lines). Blue dashed lines represent the start or end phases of the eclipses.
Other Images in This Article
Copyright and Terms & Conditions
© 2025. The Author(s). Published by the American Astronomical Society.
Copyright ©
2025 Astronomy Image Explorer. All Rights Reserved.