Image Details
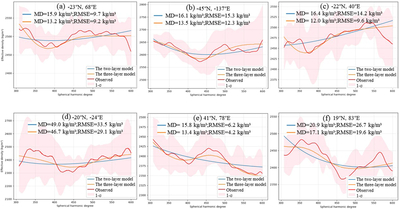
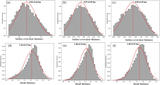
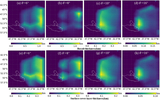
Caption: Figure 10.
The comparative analysis of the fitting results between the three-layer and two-layer models for selected examples from lunar cryptomaria regions. Here, MD and RMSE represent the mean difference and the rms error, respectively, between the modeled and observed effective densities.
Other Images in This Article

Show More
Copyright and Terms & Conditions
© 2025. The Author(s). Published by the American Astronomical Society.
Copyright ©
2026 Astronomy Image Explorer. All Rights Reserved.