Image Details
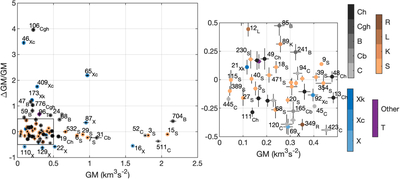
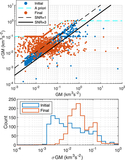
Caption: Figure 11.
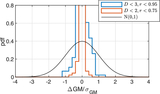
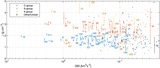
Relative difference (GMtax − GMfin)/GMfin between GM estimates via taxonomy and final estimates. We only include estimates with SNR > 10, color coded by taxonomic types. The right panel is a detailed view of the region of GM < 5 km3 s−2 and ﹩\left|{\rm{\Delta }}{\rm{GM/GM}}\right|﹩ < 0.5. The error bars show uncertainties and relative uncertainties (1σ) of the final estimates.
Other Images in This Article
Show More
Copyright and Terms & Conditions
© 2025. The Author(s). Published by the American Astronomical Society.
Copyright ©
2025 Astronomy Image Explorer. All Rights Reserved.