Image Details
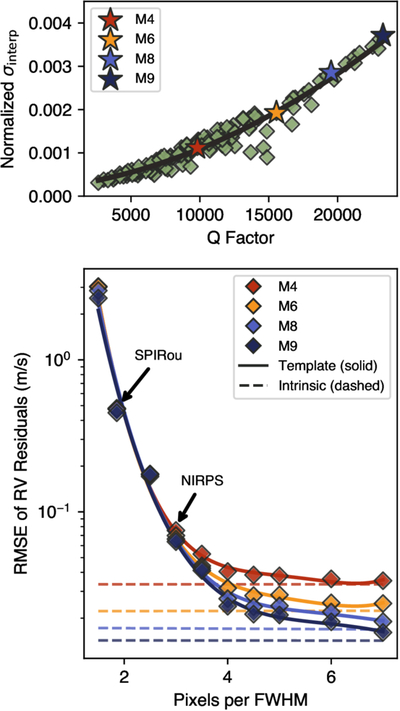
Caption: Figure 6.
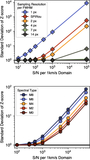
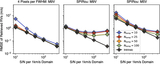
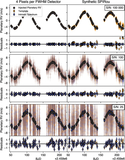
Top: the normalized interpolation error, represented by the term in square brackets in Equation (5), is plotted against the spectral quality factor and follows a second-order polynomial shown by the black line. Diamonds indicate various spectra, with the positions of example M4, M6, M8, and M9 stars highlighted. Bottom: this provides the RV uncertainty floor due to interpolation error for a given spectral type and sampling resolution. RMSE in RV estimates for where S/N is 1000 per 1 km s−1 domain across sampling resolutions and spectral types. Dashed lines show RV precision using the intrinsic spectrum. Template-based estimates are limited to ∼0.5 m s−1 for SPIRou. A fourth-order polynomial fit captures template-based interpolation error.
Other Images in This Article
Copyright and Terms & Conditions
© 2025. The Author(s). Published by the American Astronomical Society.