Image Details
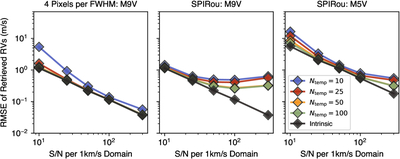
Caption: Figure 5.
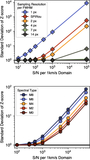
The root mean squared error of the estimated RVs for 100 evaluation observations for templates created with a varying number of observations, Ntemp, and with the intrinsic stellar spectrum. In the first panel, we plot the RMSE for a hypothetical instrument with 4 pixels per FWHM observing an M9 star. We see that the RMSE of the template follows Poisson statistics. In the second panel, we observe the same M9 star but at the sampling resolution of SPIRou. Here we see an RMSE plateau at high S/N due to interpolation error. In the last panel, we compare this to observations of an M5 star with SPIRou.
Other Images in This Article
Copyright and Terms & Conditions
© 2025. The Author(s). Published by the American Astronomical Society.
Copyright ©
2025 Astronomy Image Explorer. All Rights Reserved.