Image Details
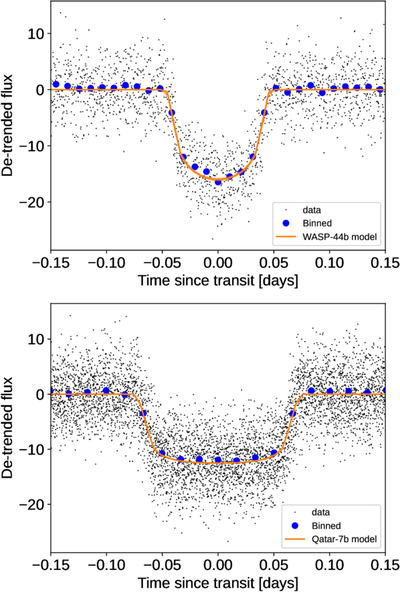
Caption: Figure 4.
Phase curve of WASP-44b (top) and Qatar-7b (bottom) using TESS data centered around the primary transit. Observed data are shown in black, binned data in blue and the obtained transit model in orange color.
Other Images in This Article
Copyright and Terms & Conditions
© 2025. The Author(s). Published by the American Astronomical Society.
Copyright ©
2025 Astronomy Image Explorer. All Rights Reserved.