Image Details

Caption: Figure 1.
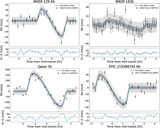
The Rossiter–McLaughlin effect of WASP-35b, WASP-44b, WASP-45 Ab, WASP-54 Ab, WASP-91b, and WASP-99b. The observed data points (black) are shown with their error bars. The systemic and Keplerian orbit velocities were removed. The blue line shows the best fitting model to the data, together with 1σ (dark gray) and 3σ (light gray) confidence intervals.
Other Images in This Article
Copyright and Terms & Conditions
© 2025. The Author(s). Published by the American Astronomical Society.
Copyright ©
2025 Astronomy Image Explorer. All Rights Reserved.