Image Details
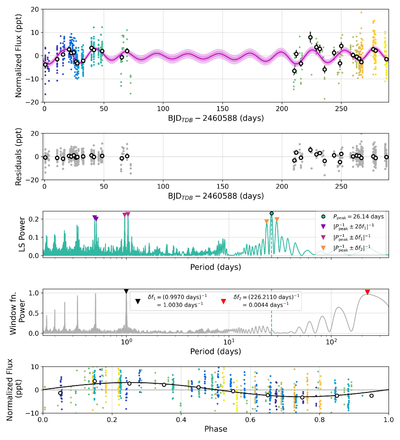
Caption: Figure 1.
First row: the Tierras light curve at the native 30 s cadence (great points) along with the best-fit quasiperiodic Gaussian process (QP-GP; magenta). The data are colored by time and have been corrected with a linear function of sky background given by c0 + c1 · sky. The 1σ and 2σ uncertainty regions of the best-fit QP-GP model are shown as shaded regions. The white points show the data binned over two-night intervals. Second row: the residuals from the best-fit QP-GP model. The residual scatter is larger between days 210 and 245 due to a smaller number of visits per night during that time period. Third row: The LS periodogram of the data. The peak of the periodogram is at Ppeak = 26.14 days. The next six highest peaks are indicated with triangles. These peaks are expected aliases of Ppeak given the periods at which the window function (fourth row) has significant power. Fifth row: the data phase-folded on a period of 26.38 days, the rotation period inferred from the GP model. The color of the points matches that in the first row and indicates the progression of time. White points show the data binned over equal widths in phase. We plot a sine model in black to show the periodic nature of the variability.
Other Images in This Article
Copyright and Terms & Conditions
© 2025. The Author(s). Published by the American Astronomical Society.