Image Details
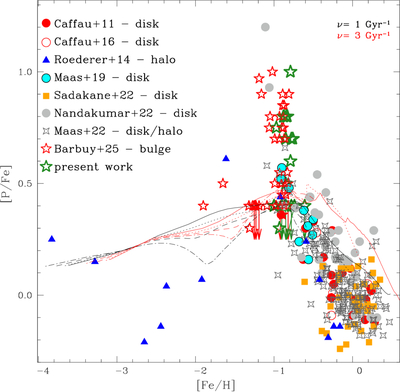
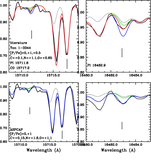
Caption: Figure 3.
[P/Fe] vs. [Fe/H] for the present results compared with literature data. Dark green open stars: present work; red-filled circles: E. Caffau et al. (2011); red open circles: E. Caffau et al. (2016); blue-filled triangles: I. U. Roederer et al. (2014); filled cyan circles and open black circles: Z. G. Maas et al. (2019); light-gray filled circles: G. Nandakumar et al. (2022); light-gray open four-sided stars: Z. G. Maas et al. (2022); red open stars: B. Barbuy et al. (2025). Different model lines correspond to the outputs of models computed for radii r < 0.5, 0.5 < r < 1, 1 < r < 2, and 2 < r < 3 kpc from the Galactic center. Black lines correspond to specific star formation ν = 1 Gyr−1, red lines to ν = 3 Gyr−1.
Other Images in This Article
Copyright and Terms & Conditions
© 2025. The Author(s). Published by the American Astronomical Society.