Image Details
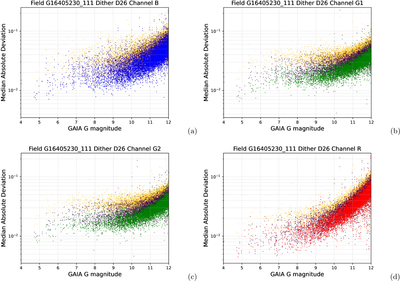
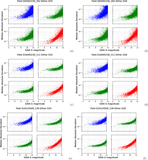
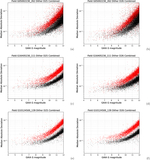
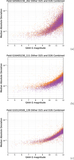
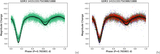
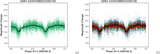
Caption: Figure 5.
The scatter (median absolute deviation from the median (MAD)) of the individual channel light curves vs. GAIA G magnitude before EPD (only magnitude fitting, indicated by yellow points), after EPD but before TFA (indicated by purple points), and after TFA (indicated by their corresponding channel color (B (blue)(a), G1 (green)(b), G2 (green)(c), R (red)(d)) points). These plots are for dither pattern D26, field G111. These show the overall improvements from our postprocessing steps.
Other Images in This Article
Show More
Copyright and Terms & Conditions
© 2025. The Author(s). Published by the American Astronomical Society.
Copyright ©
2026 Astronomy Image Explorer. All Rights Reserved.