Image Details
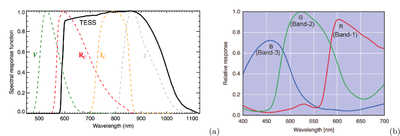
Caption: Figure 4.
The different bandpasses used by (a) TESS (image credit: G. R. Ricker et al. 2015) and (b) the Sony-α 7R II (ILCE-7RM2) DSLR camera (image credit: K. Sato et al. 2016) (a). Here, we show the “TESS spectral response function (black line), defined as the product of the long-pass filter transmission curve and the detector quantum efficiency curve. Also plotted, for comparison, are the Johnson-Cousins V, RC, and IC filter curves and the Sloan Digital Sky Survey z filter curve. Each of the functions has been scaled to have a maximum value of unity” (G. R. Ricker et al. 2015). (b) The Sony-α 7R II uses an Exmor R CMOS sensor, and here its spectral response function for each image band is shown, where each function has been scaled to a maximum value of unity as well.
Other Images in This Article
Show More
Copyright and Terms & Conditions
© 2025. The Author(s). Published by the American Astronomical Society.