Image Details
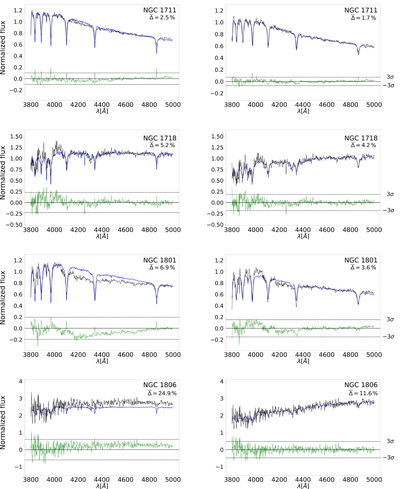
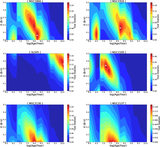
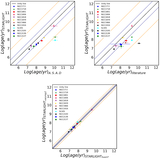
Caption: Figure 10.
Normalized reddening-corrected spectrum using A.S.A.D. (left panels) and observed normalized spectrum using STARLIGHT (right panels) in black, and the best matching models fit in blue. The residual flux is presented in green. The dotted lines are at ±3σ. The percentage mean (﹩\overline{{\rm{\Delta }}}﹩) is indicated for each cluster.
Other Images in This Article

Show More
Copyright and Terms & Conditions
© 2025. The Author(s). Published by the American Astronomical Society.
Copyright ©
2025 Astronomy Image Explorer. All Rights Reserved.