Image Details
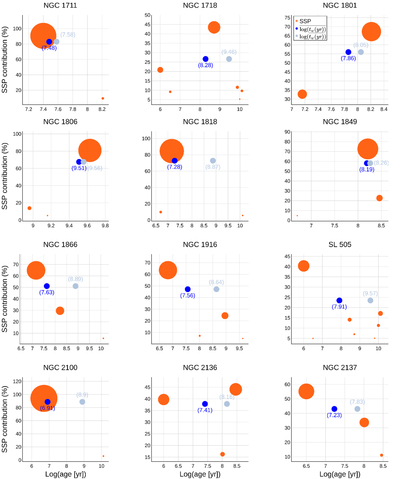
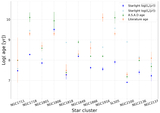
Caption: Figure 1.
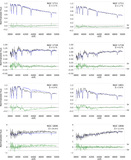
SSP contributions for each star cluster from the STARLIGHT results. From upper left to bottom right: NGC 1711, NGC 1718, NGC 1801, NGC 1806, NGC 1818, NGC 1849, NGC 1866, NGC 1916, SL 505, NGC 2100, NGC 2136, and NGC 2137. In orange the SSP, in blue and light blue are the weighted average log(age), (﹩\overline{{\mathrm{log}}\,({t}_{w}(\mathrm{yr})})﹩, and the log of weighted average age, (﹩{\mathrm{log}}\,(\overline{{t}_{w}(\mathrm{yr}))}﹩), respectively. The size of the orange circles means the contribution rate of each SSP.
Other Images in This Article

Show More
Copyright and Terms & Conditions
© 2025. The Author(s). Published by the American Astronomical Society.
Copyright ©
2025 Astronomy Image Explorer. All Rights Reserved.