Image Details
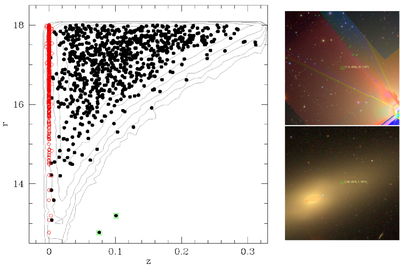
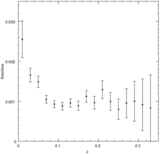
Caption: Figure 5.
(Left) Redshift vs. apparent r-band magnitude plot. Red open circles show the redshift by SDSS DR16, and black filled circles show the measurements in this study. Background shows a number contour of all SDSS DR16 galaxies (photometric type = GALAXY) with spectroscopic redshift in 0 < r < 18 and 0.002 < z < 0.35. Green open rectangles show outliers. (right) SDSS DR16 finding charts around the outliers in the left panel.
Other Images in This Article

Copyright and Terms & Conditions
© 2025. The Author(s). Published by the American Astronomical Society.
Copyright ©
2026 Astronomy Image Explorer. All Rights Reserved.