Image Details
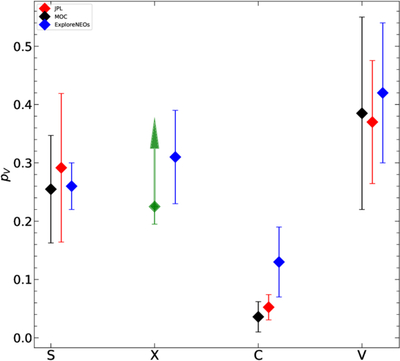
Caption: Figure 6.
Average visible albedo of NEOs by taxonomic type. Black and red diamonds illustrate the average pV using HV from MOC and JPL, respectively. In blue diamonds, we show the comparable average albedos for complex taxonomies from previous ExploreNEOs work by C. A. Thomas et al. (2011). In green, we show the average and the range of albedos for X-complex based on our estimates from weakly detected objects.
Other Images in This Article
Copyright and Terms & Conditions
© 2025. The Author(s). Published by the American Astronomical Society.
Copyright ©
2025 Astronomy Image Explorer. All Rights Reserved.