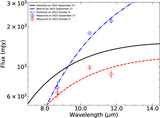
Image Details
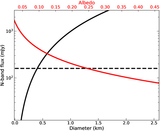
Caption: Figure 1.
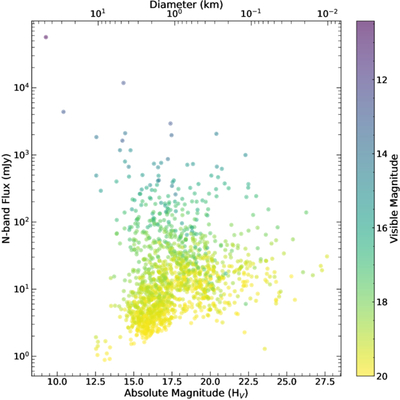
Predicted N-band flux as a function of solar system absolute magnitude HV for all observable NEOs from the NASA-IRTF during a given observing semester. The top axis is the estimated diameter from HV assuming a 15% albedo in the A. W. Harris & J. S. V. Lagerros (2002) relationship. Each circle’s color indicates the visible magnitude of the NEO at the time it reached peak in brightness. Yellow represents fainter objects (larger visible magnitude), while purple represents brighter ones.
Other Images in This Article
Copyright and Terms & Conditions
© 2025. The Author(s). Published by the American Astronomical Society.
Copyright ©
2025 Astronomy Image Explorer. All Rights Reserved.