Image Details

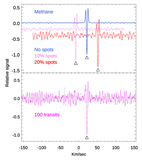
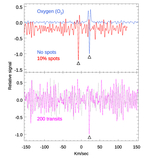
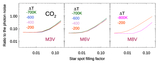
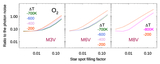
Caption: Figure 4.
Comparison of our calculated S/Ns for CC detections with those of M. H. Currie et al. (2023), showing four different planetary host star/atmospheric molecule combinations. In each case, the S/N for the detection of the molecule in question is plotted vs. the number of transits (solid blue and red lines), and S/N increases as the square root. Our S/Ns are calculated using multiple Monte Carlo trials, and the dashed red lines give the ±1σ bounds on our calculations. The bottom X-axis is only for the bottom panel, and the top X-axis is for the remaining panels. The distance of each system is adopted to be 12 pc, and the results from M. H. Currie et al. (2023) are from their Figure 13.
Other Images in This Article

Show More
Copyright and Terms & Conditions
© 2025. The Author(s). Published by the American Astronomical Society.