Image Details
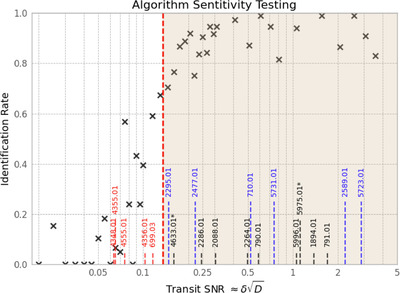
Caption: Figure 2.
Each X marker in this figure represents transits from six similar signal strength TOIs, plotted at the mean signal value of the group, in order to ensure a large enough number of transits for every data point. The adopted signal strength threshold marked by the red dotted line is at ﹩\delta \sqrt{D}=0.135﹩. Along the horizontal axis, we plot the 20 candidates from Sections 3.1 (in blue) and 3.3 (in black or red) with red text indicating a low signal strength candidate. The asterisks denote candidates that are in both sections.
Other Images in This Article
Copyright and Terms & Conditions
© 2025. The Author(s). Published by the American Astronomical Society.
Copyright ©
2026 Astronomy Image Explorer. All Rights Reserved.