Image Details
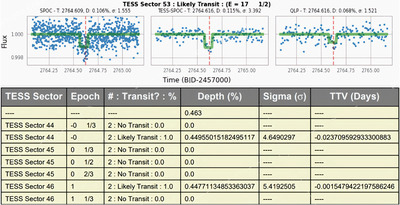
Caption: Figure 1.
TOP: an example of a transit found and reported by the algorithm. The green line represents the best fit, and the dashed red line represents the predicted transit time for the alias. This specific case shows three reductions of the same data from different available pipelines. In each, a transit occurring 17.5 orbits after the originally reported transit is found. This is evidence that the reported period is at least double the true period for this particular planet. BOTTOM: an example of the table of transits produced by the algorithm. We report the sector searched, the alias of the period as the epoch after the original transit, a qualitative prediction of whether there was a transit, the measured depth, sigma heuristic, and calculated transit timing variation. These last three categories are only reported if the algorithm thinks there is a transit based on the data.
Other Images in This Article
Copyright and Terms & Conditions
© 2025. The Author(s). Published by the American Astronomical Society.