Image Details
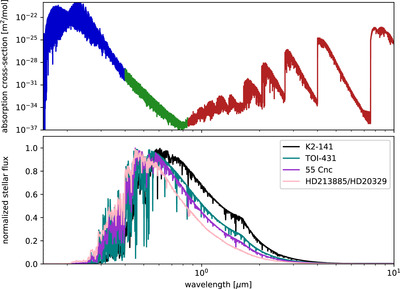
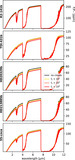
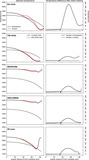
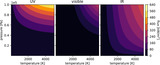
Caption: Figure 1.
Top: the absorption cross section of SiO (S. N. Yurchenko et al. 2022). The blue, green, and red show the UV, visible, and IR ranges. Bottom: the normalized flux of each star using close analogs.
Other Images in This Article
Copyright and Terms & Conditions
© 2024. The Author(s). Published by the American Astronomical Society.
Copyright ©
2026 Astronomy Image Explorer. All Rights Reserved.