Image Details
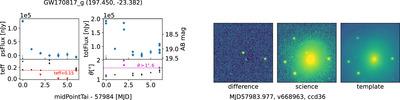
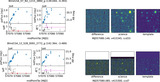
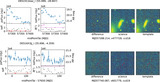
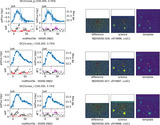
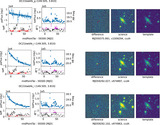
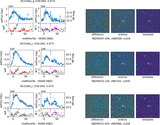
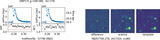
Caption: Figure 2.
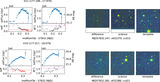
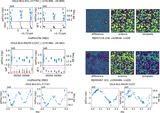
Left and middle panels: light curves of the KN of GW170817 in the g band from the forced photometry of the difference image and direct image, respectively. We give the celestial coordinates (R.A., decl.) in the title. Here, psFlux is the point-source PSF flux from the difference image, while totFlux is from the direct (science) image. The gray vertical tick in each light-curve diagram shows the time of the difference/direct image on the right. The “midPointTai” means the International Atomic Time (Temps Atomique International in French, TAI) at the middle of the exposure. Underneath, we provide the weather metrics—seeing (FWHM θ in arcseconds) and the effective exposure time teff obtained from qcInv for reference. For the exposures, we consider that seeing has the greatest impact on teff compared to other observing conditions such as transparency, sky brightness, and airmass. The horizontal dashed lines give the thresholds of poor weather conditions (teff = 0.15 and θ = 1.″6), and the triangle markers highlight the conditions worse than the thresholds. Right panels: the difference image from the first day (i.e., the flux peak; visit 668963 at CCD 36, MJD 57983.977; 300 × 300 pix; North on the top and East on the left; scaled by arcsinh), together with the processed science (direct) image and the template. The target (KN) is at the image center. The source near the right edge of the difference image is probably from a variable star.
Other Images in This Article
Show More
Copyright and Terms & Conditions
© 2024. The Author(s). Published by the American Astronomical Society.