Image Details
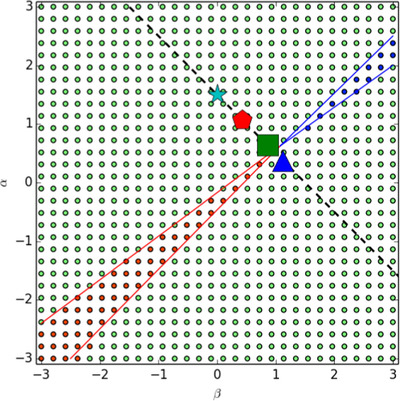
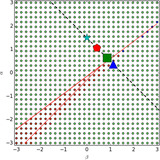
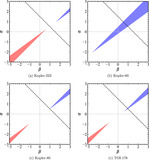
Caption: Figure 3.
Numerical results in (α, β) space for the migration of a pair of 1 M ⊕ planets in 3:2 MMR. Blue and red dots represent simulations where the MMR is maintained as the planets move inward and outward, respectively. Green dots represent the simulations where the MMR is broken. The blue and red solid lines are the analytic estimation of the convergent migration regions from Equations (6), (7), and (8). The black dashed line is α + β = 3/2 for the steady-state, constant α ν -viscosity disk models, with the star for the MMSN-like model and the other symbols for various regions of the Garaud & Lin (2007) disk model: pentagon for the weakly opaque region, square for the strongly opaque region, and triangle for the viscously heated region.
Other Images in This Article
Copyright and Terms & Conditions
© 2024. The Author(s). Published by the American Astronomical Society.