Image Details
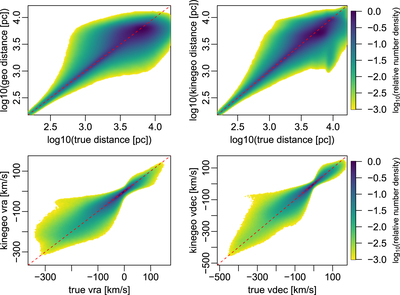
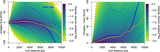
Caption: Figure 6.
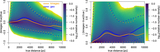
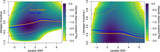
Estimated distances and velocities vs. their true values for the constant fraction sample in the mock catalog. The color scale denotes the density of points on a logarithmic scale relative to the maximum in that panel, with densities less than a thousandth of the peak in white.
Other Images in This Article
Show More
Copyright and Terms & Conditions
© 2023. The Author(s). Published by the American Astronomical Society.
Copyright ©
2025 Astronomy Image Explorer. All Rights Reserved.