Image Details
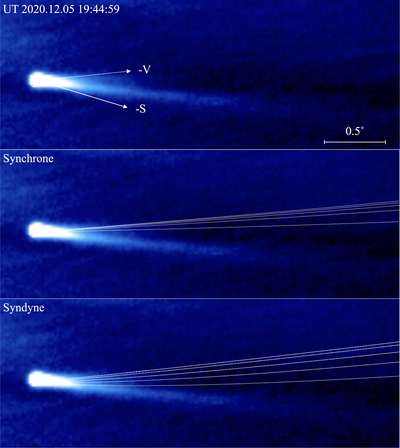
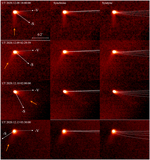
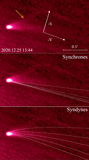
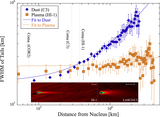
Caption: Figure 4.
An example image taken with the HI-1 wide-field camera. Top: the median image from UT 2020 December 05. The anti-Sun (−S) and antiorbital (−V) directions are indicated by solid and dashed arrows, respectively. The bright long tail is the plasma tail. The faint tail above the plasma tail is the dust tail. The middle and bottom panels are the modeled synchrones and syndynes overlapping the image. Synchrones were computed for ejection times of 20, 40, 60, 80, and 100 days prior to the date of observation (curves from bottom to top, in the figure). Syndynes were computed for β = 1, 0.3, 0.1, 0.03, and 0.01 (curves from bottom to top), corresponding to nominal particle radii of 1, 3, 10, 30, and 100 μm, respectively. Celestial north is up, east is to the left. The region shown is 3.°2 × 1.°2 (160 × 60 pixels).
Other Images in This Article
Show More
Copyright and Terms & Conditions
© 2023. The Author(s). Published by the American Astronomical Society.