Image Details
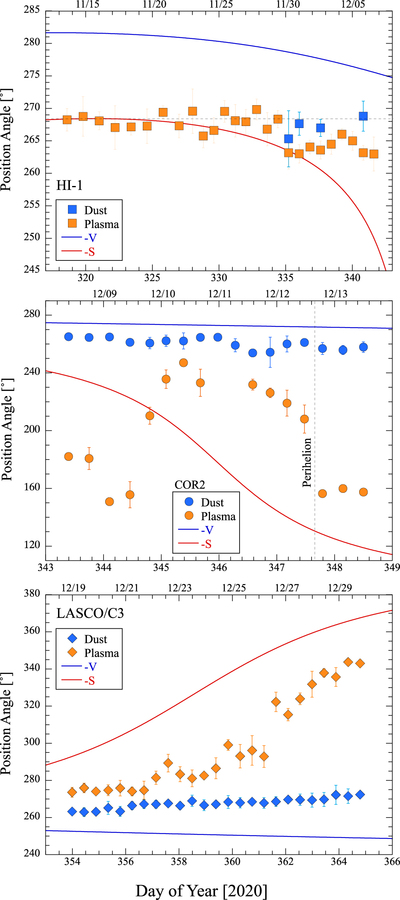
Caption: Figure 10.
Time dependence of the position angle of the dust (blue) and plasma (orange) tails from HI-1 (top), COR2 (middle), and C3 (bottom). Position angle uncertainties on some points are comparable to the size of the symbols used to plot the data. Red and blue solid curves are the anti-Sun (−S) and anti-orbital-motion (−V) directions, respectively. The time of perihelion is marked with a vertical dotted line on the COR2 (middle) panel. The data points are presented in Tables 2, 3, and 4. Note that five orange data points are above the horizontal dotted line in the top panel. The comet aberration angles cannot be resolved with these data points using the current technique. The calendar dates are shown on the top horizontal axis.
Other Images in This Article
Show More
Copyright and Terms & Conditions
© 2023. The Author(s). Published by the American Astronomical Society.