Image Details
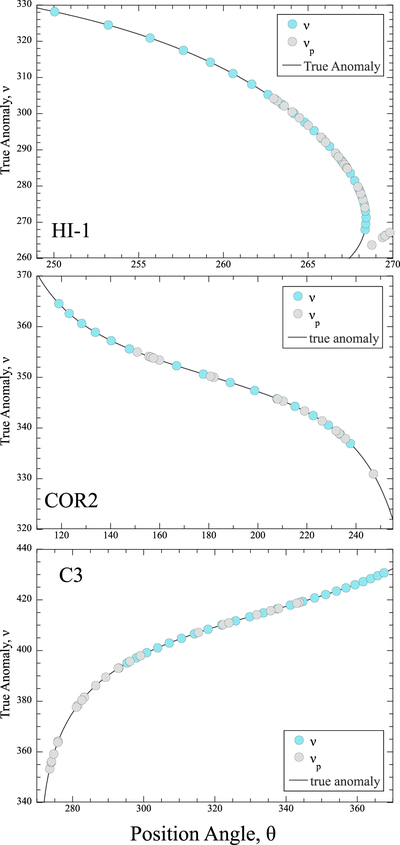
Caption: Figure 12.
The comet’s true anomaly (ν) as function of antisolar position angle (θ). Functions are plotted as solid black curves provided by JPL Horizons in all three panels. Light blue circles represent the comet’s true anomaly (ν) at the time of observation. Gray circles represent the comet’s true anomaly (ν p ) inferred from the tail position angles (θ plasma). The three panels correspond to the HI-1, COR2, and C3 instruments. Note the five gray data points are not on the black curve on the top panel for HI-1. The true anomaly cannot be solved for these data points.
Other Images in This Article
Show More
Copyright and Terms & Conditions
© 2023. The Author(s). Published by the American Astronomical Society.