Image Details
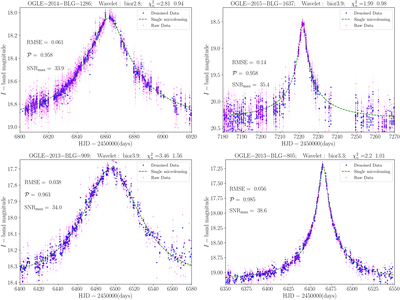
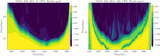
Caption: Figure 4.
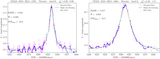
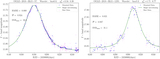
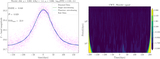
Examples of denoised data due to four real microlensing events found by the OGLE group. The OGLE name of each event, the best-performing wavelet, and the values of ﹩{\chi }_{n}^{2}﹩ for raw and denoised data (respectively) are mentioned at the top of each plot. The best-fit single microlensing light curves (as characterized in the OGLE page) are shown with dashed green curves.
Other Images in This Article
Copyright and Terms & Conditions
© 2023. The Author(s). Published by the American Astronomical Society.
Copyright ©
2026 Astronomy Image Explorer. All Rights Reserved.