Image Details
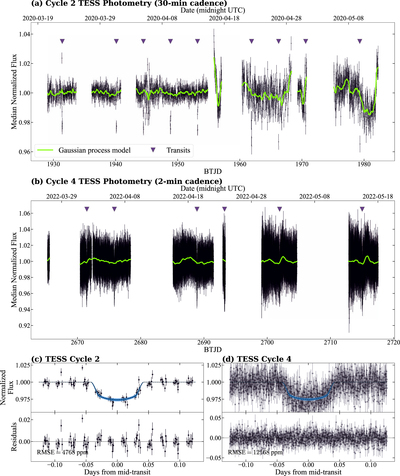
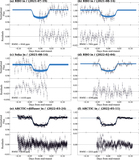
Caption: Figure 3.
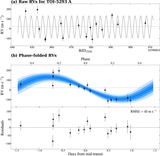
(a) Median normalized TESS long-cadence light curve for TOI-3984 A derived with eleanor. The solid green line is the best-fitting Gaussian process model used to detrend the light curve. The triangles indicate the observed transits. (b) Same as panel (a) but for short-cadence TESS data. Panels (c) and (d) show the phase-folded light curves for short- and long-cadence TESS data. In panels (c) and (d), the best-fitting model from the joint fit to the photometry and RVs is plotted as a dashed line, while the shaded regions denote the 1σ (darkest), 2σ, and 3σ (lightest) extent of the model posteriors. The modeling of the photometry and RVs is described in detail in Section 4.
Other Images in This Article
Show More
Copyright and Terms & Conditions
© 2023. The Author(s). Published by the American Astronomical Society.