Image Details
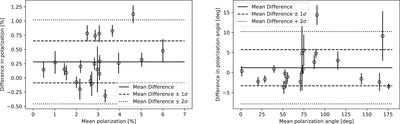
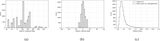
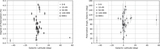
Caption: Figure 2.
Bland–Altman plots for the differences in measurements between Heiles and IPS-GI. Variable stars were removed from the comparison. Left: degree of linear polarization. Right: angle of linear polarization with BD–14 4922 removed. Solid lines indicate the mean difference between the two data sets. Dashed and dotted lines represent the 1σ and 2σ limits of agreement, respectively. Error bars indicate the errors of both measurements, added in quadrature.
Other Images in This Article

Show More
Copyright and Terms & Conditions
© 2023. The Author(s). Published by the American Astronomical Society.
Copyright ©
2026 Astronomy Image Explorer. All Rights Reserved.