Image Details
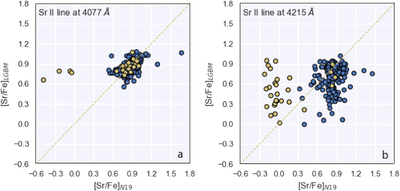
Caption: Figure 4.
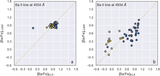
Comparisons of the Sr abundances calculated by our work ([Sr/Fe]LGBM) and values determined from N19 ([Sr/Fe]N19). The yellow line represents that the predicted value is equal to the target value. The yellow dot represents the point at which ∣[Sr/Fe]4077 Å − [Sr/Fe]4215 Å∣ ≥ 0.5 in N19. The left shows the differences between [Sr/Fe]LGBM and [Sr/Fe]N19 in the prediction of 4077 Å (Sr II), and the right shows these differences in the prediction of 4215 Å (Sr II).
Other Images in This Article
Copyright and Terms & Conditions
© 2023. The Author(s). Published by the American Astronomical Society.
Copyright ©
2026 Astronomy Image Explorer. All Rights Reserved.