Image Details
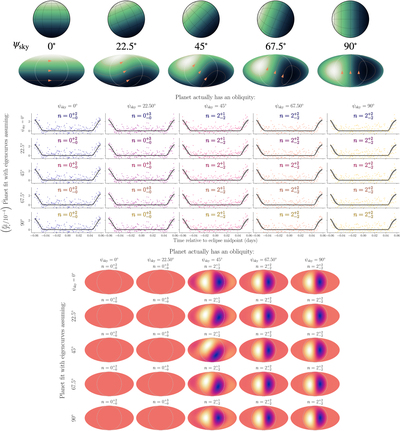
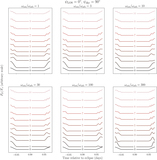
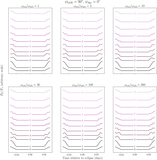
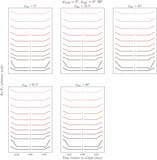
Caption: Figure 16.
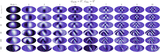
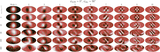
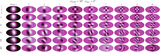
Eclipse maps and curves from fits to simulated data from model planets with polar hotspots with spin axes inclined from 0–90° with respect to the plane of the sky. The input maps are shown at the top in green, as it would be oriented to the observer at the time of mid-ingress. The equivalent full-globe Mollweide projections are shown just below to compare with the equivalent projections of the retrieved maps. ω rot/ω orb is equivalent to how many times the planet rotates per orbit. We generate 10,000 realizations of Gaussian noise for each simulated eclipse curve, and fit each with some number n of eigencurves (i.e., parameters), where n is determined by a Bayesian Information Criterion (BIC). The mode and ±1σ of n are shown for each case. Recovered curves and maps are shown based on the rotation rate of the model used to generate the data (x-axis), vs. the rotation rate of the eigenbasis used to fit the data (y-axis). Each subplot of the eclipse curve grid shows the range of uncertainty used to artificially noise the simulated data, with one example realization of the 10,000 in colored points. The fit is shown in greyscale; the solid line is the median of all fits and a shaded region shows the ±1σ (≈16th and 84th percentiles) range of fits. We show maps generated using the median values of the coefficients from each eigenmap.
Other Images in This Article
Show More
Copyright and Terms & Conditions
© 2022. The Author(s). Published by the American Astronomical Society.