Image Details
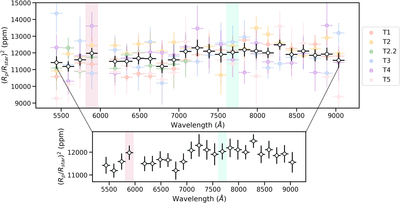
Caption: Figure 4.
The final averaged transmission spectrum of HATS-5b, obtained as a weighted average of the single transit’s contributions, which are also shown in the top panel. The red and green shaded regions mark the bins where Na I and K I features would be present, respectively.
Other Images in This Article


Show More
Copyright and Terms & Conditions
© 2022. The Author(s). Published by the American Astronomical Society.
Copyright ©
2026 Astronomy Image Explorer. All Rights Reserved.