Image Details
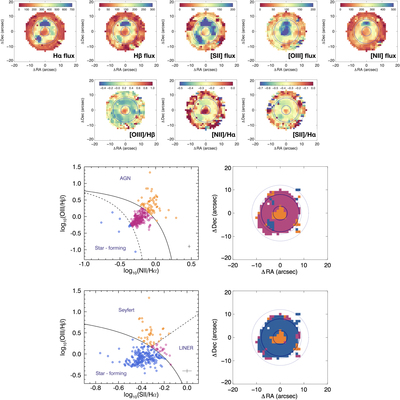
Caption: Figure 6.
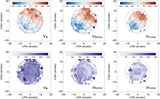
In the top, Hα, Hβ, [S II], [O III], and [N II] line flux (10−17 erg s−1 cm−2) and line-ratio maps of NGC 3182 are presented. In the bottom, we present emission-line-ratio diagrams and maps for [O III]5007/Hβ vs. [N II]6583/Hα and [O III]5007/Hβ vs. [S II]6731/Hα color coded by ionization source. The representative uncertainties are shown bottom right corner of each panel. Lines in the diagrams are from Kauffmann et al. (2003) and Sharp & Bland-Hawthorn (2010), respectively, to separate star forming, the AGN, and LINERs. Circles are the same as in Figure 4.
Other Images in This Article
Copyright and Terms & Conditions
© 2023. The Author(s). Published by the American Astronomical Society.
Copyright ©
2026 Astronomy Image Explorer. All Rights Reserved.