Image Details
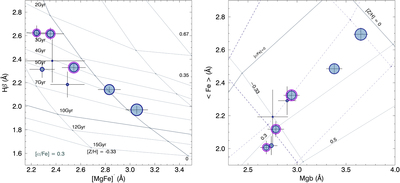
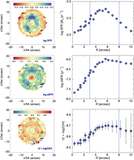
Caption: Figure 2.
Hβ vs. [MgFe]﹩{}^{{\prime} }﹩ (left) Mgb vs. 〈Fe〉 (right) diagrams for NGC 3182 from center to outskirt with TMB model grids for ages, metallicities, and abundance ratios. The line strengths are measured along annuli. Symbol sizes are proportional to the radius. The regions of the star-forming ring (3″–8″) are enclosed with violet circles. In the Mgb vs. 〈Fe〉 diagram, solid and dashed lines are the 10 Gyr and 2 Gyr models, respectively. The model lines of [Z/H] = 0 in the right panel are emphasized as thick lines for each age. Each error bar indicates the measurement uncertainties in each annulus.
Other Images in This Article
Copyright and Terms & Conditions
© 2023. The Author(s). Published by the American Astronomical Society.
Copyright ©
2026 Astronomy Image Explorer. All Rights Reserved.